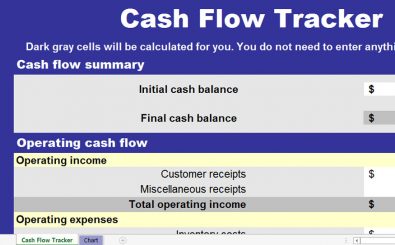
Cash Flow Chart Excel Template
The statement of cash flows or cash flow chart Excel templates summarize cash inflow and outflow.
The term cash here represents both the money in the bank account and physical cash. On the other hand, the cash flow statement is just like any standard financial document, like an income statement or a balance sheet.
These cash flow chart Excel templates contain three categories: financing, investing, and operating. You will also notice that the cash-in and cash-out show together with a period’s start and end. And we will further discuss both below.
To analyze your cash flow Microsoft Excel templates, compare several months of cash flow to come up with an estimate or have a budget for future cash flows.
How to Use Free Cash Flow Excel Templates
Cash flow Microsoft Excel templates are a simple way to analyze, create models, and present data insightfully. They are a great way to familiarize the data analysis capability and demonstrate how built-in templates can make data analysis easy.
There are a couple of things that you can do with cash flow excel spreadsheet templates:
- Conduct data modeling using Excel’s modeling capabilities
- Use time intelligence capabilities
- Use Measures that come in handy in a cash flow statement
Essentials of Cash Flow Chart Excel Spreadsheet Statement
1. Financing Activities
Financing activities include creditor borrowing and loan repayments, stock issuing and repurchasing, collecting investor/owner money, and cash dividend payments. This is part of the cash flow statement that showcases the long-term liabilities and the equity of the stockholders and owners from the balance sheet.
2. Investing Activities
Buying and selling assets like equipment and property, lending money to others and getting the principal, and buying and selling investment securities. This is part of the balance sheet associated with long-term assets.
3. Operating Activities
Operating activities are the activities of a business that make up daily operating tasks like purchasing inventory, selling products, making wage payments, and settling operating expenses.
The key part of a cash flow statement is the ‘Net Cash Flow from Operations.’ The operating activities section of a business is linked with the Current Assets & Current Liabilities parts of a balance sheet, as well as the Income statement’s Revenue and Expenses part.
Create a Forecast by utilizing a Cash Flow Chart Excel Template.
When you project future cash flows, you are giving yourself stable financial control that provides a deeper understanding of a company’s performance. Projecting future cash flows allows you to identify the shortfalls before they happen and support business planning to align resources and activities properly. New business ventures seeking a loan may need a cash flow forecast.
If you want to plan to succeed, it is important to have a realistic cash flow forecast. You can start with important assumptions about the monthly cash flow to and from your business.
For example, you may identify the days your business will receive payments and when payments are due. This will allow you to make accurate assumptions about the funds you need.
Note that you will always have varying cash flows from the actual performance, making it important to compare real numbers to the projections you have placed every month and you update the cash flow forecast. It is wise to limit your forecast to a yearly period for better accuracy. You can add another month every month to create a long-term rolling projection.
How to Prepare a Cash Flow Statement
Collect the Following Documents:
- The balance sheet as at the end and the beginning of the reporting period at hand (closing b/s and opening b/s)
- Comprehensive income statement
- Changes in equity statement for the reporting period at hand
- Cash flow statements for the previous reporting period
- Material transaction details of the current reporting period. They can include major contracts your company has entered before or during the end of the reporting period
- Memoranda minutes of management bodies of your company
- Legal department files and documents from the long-term assets or investment assets
Analyzing a Cash Flow Chart in Excel.
A business owner has to look at the last two years of the company’s balance sheets and check the difference to come up with a statement of cash flows. You can get details from the income statement and balance sheets to develop a statement of cash flows.
Preparation and Analysis of Statements of Cash Flows
Analyze the statement of cash flows by looking at the uses of money and the sources from the two balance sheets. Check a line-by-line analysis of the cash flow analysis of your cash flow statement.
Conduct a Free Cash Flow for Your Company
The free cash flow calculation is one of the most important calculations that provide important results. Free cash flow is the money a company has in store as a balance after capital expenditures are paid, for instance, a piece of equipment or a new facility.
Free cash flow can be said to be the gold standard of your company’s financial health. Adding your company’s free cash flow to your cash flow analysis will make the cash flow analysis stronger.
Calculate Cash Flow Ratios
There are quite a number of financial ratios that can help you as an owner concentrates on the cash flow. When you calculate your company’s cash flow, you can tell its solvency, liquidity, and viability.
Wrapping Up
In summary, cash flow chart Excel templates help you to easily customize your cash flow statement. They also help make filling in the fields easier with their pre-formatted data.
Download our free cash flow chart Excel templates today, and take advantage of their benefits!
DOWNLOAD
